





Columbus Pro is a new kind of mapping platform built for site selection, due diligence, and location research. We make exploration and discovery easier and cheaper.

Columbus LogoColumbus Pro

Earth for business

Agentic GIS so easy, the janitor could be your new researcher

Start Now
Columbusuntitled chat
Report ViewSave MapshotEdits not saved
Forecast the districts in greater Munich most at risk of traffic-congestion growth over the next 2–3 years
Columbus forecasted your question

Here are the districts in greater Munich forecasted to experience the worst traffic-congestion growth over the next 2–3 years

Top 4 Districts by Forecasted Congestion Growth
Next 24–36 Months
  1. 1Schwabing-West+14.2%
  2. 2Bogenhausen+12.8%
  3. 3Sendling-Westpark+11.1%
  4. 4Riem+9.7%
Key takeaway

Congestion growth concentrates on residential pipelines feeding the BMW / Siemens employment ring, with S-Bahn capacity ceilings amplifying spill-over.

Columbus Pro is an LGM and can get things wrong.

ColumbusValencia Province SitesMid-Rise · 8,000–20,000 sqm
Shared withEdits saved
Find me the top 15 development sites for mid-rise residential in Valencia province, fitting our typical envelope: 8,000–20,000 m², residential or convertible zoning, within 30 minutes of city center, with positive demographic trajectory
Columbus forecasted your question

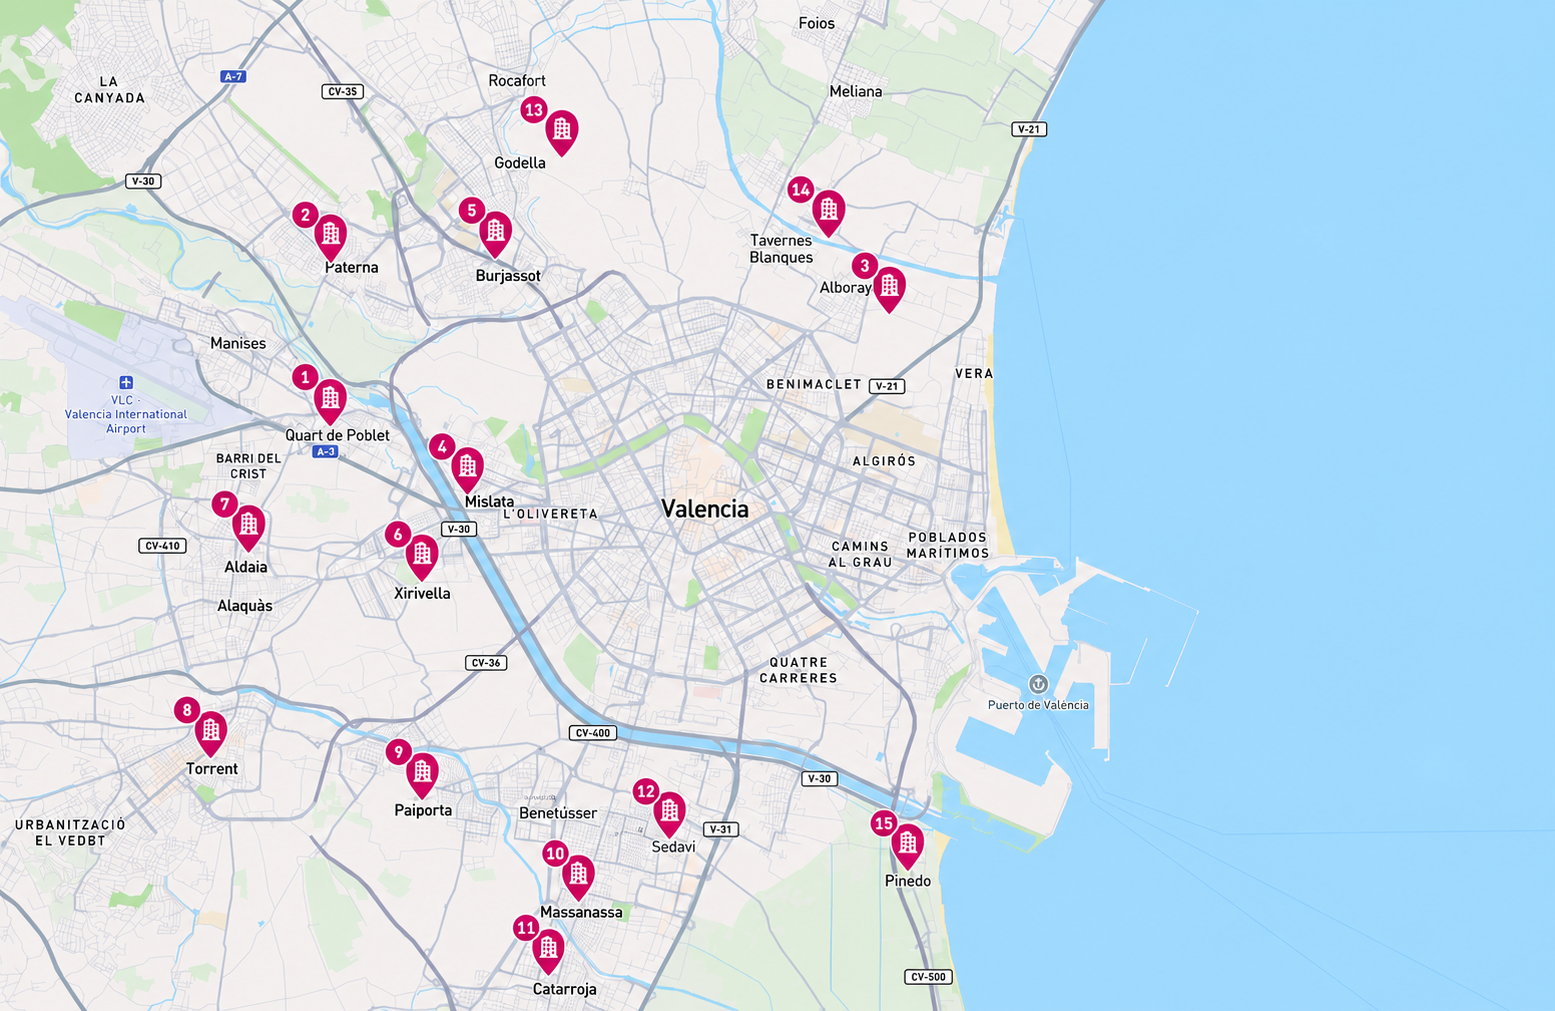
Here are the top 15 development sites for mid-rise residential across Valencia province that fit your envelope, zoning, and demographic criteria — the leading four shown

Top Sites by Development Suitability
Valencia Province · Mid-Rise · 8,000–20,000 m²
  • Quart de Poblet — Parc Central+95
  • Paterna — Lloma Llarga+91
  • Alboraya — Patacona+87
  • Mislata — Quart Sud+83
Key takeaway

The strongest sites cluster along the metro-served western corridor, where convertible zoning and net in-migration outpace the current mid-rise pipeline; PATRICOVA flood-zone exposure is the main constraint to screen next.

Columbus Pro is an LGM and can get things wrong.

Valencia Province Mid-Rise Sites: Western Metro-Corridor Convergence
Site Suitability Report · Residential · Jan 2026

Across Valencia province, the development sites best matching the 8,000–20,000 m² mid-rise envelope concentrate along the western metro corridor — Quart de Poblet, Paterna, Alboraya, and Mislata each clear the suitability threshold on zoning convertibility, sub-30-minute access to the city center, and positive demographic trajectory. These municipalities pair residential or readily convertible parcels with net in-migration running ahead of the current mid-rise pipeline.

Valencia Province · Site SuitabilityExpand
Columbus Agent

Consider layering the PATRICOVA flood-risk map to screen the western-corridor parcels before shortlisting.

ColumbusData Manager
Import dataData DigestionSmart Layers
My DataSuggestedAllBase MapsOverlaysPacksEnvironmentalInfrastructureSmart LayersDemographics
Future Hot Turnover Zones
55,010 rows

Predicts 2-5 year property value growth using migration, job forecasts, and permit trends.

Rental yield data by postal code (gross and net)
40,206 rows
Short-term rental saturation
33,520 rows

Airbnb density — relevant for assessing rental market dynamics.

ColumbusDashboard
Tell Columbus Chatbot to search
AuditsSite SelectionsChatsMapshots
SelectSort by: Newest
Mechlen County 600k sqft Property Pipeline Analysis

Analyzed 3 candidate parcels in Mechlen County for a 600,000 sqft middle-income residential site; ranked Westfield Industrial Park at 94/100 against R-3 zoning, topography, flood risk, and utilities-infrastructure criteria.

May 21, 2026Public
Amsterdam Neighborhoods Rent Growth

Cross-referenced free-sector rent growth against tram-line corridor density across 24 Amsterdam neighborhoods; surfaced 4 high-growth pockets led by De Pijp-Noord at +28.4%, with takeaway on new-build pipeline tightness over a 5-year window.

May 18, 2026Private
Valencia Mid-Rise Shortlist

Investigated 4,200+ parcels across Valencia province for 8,000–20,000 m² mid-rise envelopes; prioritized 15 sites with positive demographic in-migration and competitor pipeline density inside a 30-minute drive-time radius.

May 12, 2026Private
Patraix flood-risk vs zoning overlay

Stacked the 2050 floodplain evolution model against R-3 zoning permissions and tram-line access in the Valencia Patraix district; flagged 3 parcels at acceptable risk and 2 with disqualifying drainage history for the rezoning panel.

May 6, 2026Public
Short-term rental saturation thresholds

Modeled Airbnb density against postal-code rental yields to identify where short-term rental saturation is depressing long-term residential pricing; produced a 7-tier saturation index with thresholds tuned to mid-tier metro residential portfolios.

Apr 28, 2026Private

Legacy GIS slows you down because...

A single site selection report takes your team weeks to months to complete.
Legacy GIS requires specialists to operate their bulky complex apps.
Your analysts spend 80% of their time finding, cleaning and organizing data.
Sourcing the right data to support your research is needlessly difficult.
You use 10 different complex apps for one single project.
Combining multiple types of large data on a single map is frustrating and costly.

It’s time for a more powerful and intuitive GIS

Columbusuntitled chat
Report ViewSave MapshotEdits not saved
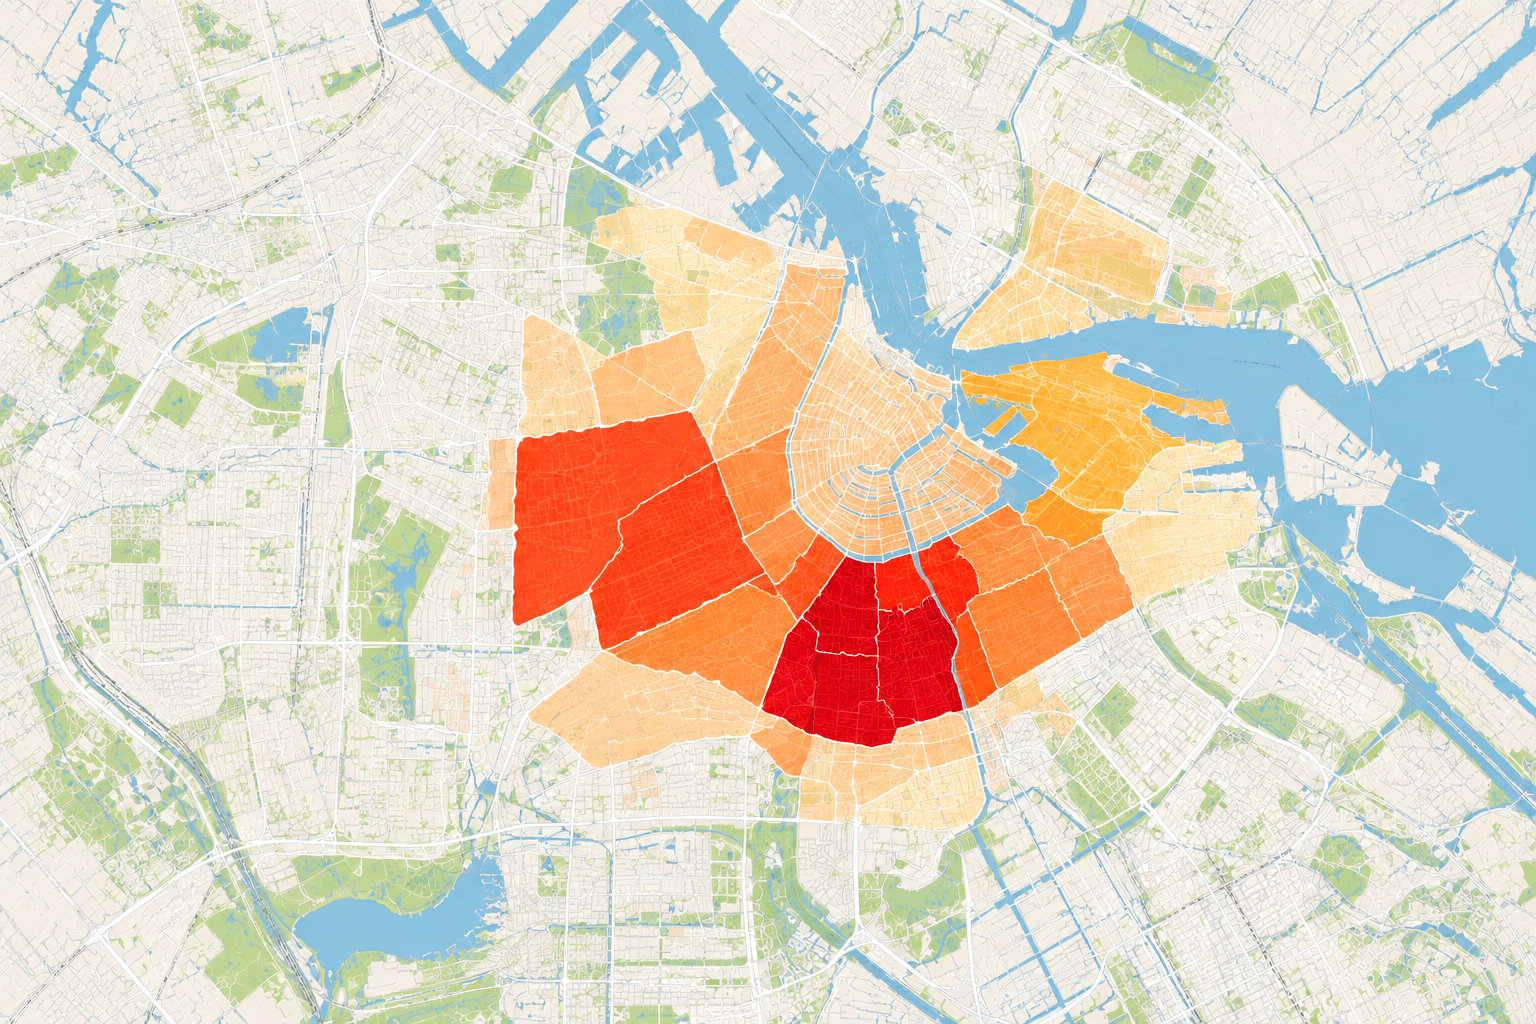
Show me which neighborhoods in Amsterdam have seen the largest rent increases over the past 5 years
Columbus forecasted your question

Here are the Amsterdam neighborhoods with the steepest free-sector rent growth over the past five years

Top 4 Neighborhoods by Free-Sector Rent Growth
Last 5 Years
  1. 1De Pijp-Noord+28.4%
  2. 2Oud-West+24.1%
  3. 3Indische Buurt+21.6%
  4. 4Oostelijke Eilanden+19.3%
Key takeaway

Rent growth concentrates in tram-served neighborhoods with tight new-build pipelines; independent business turnover lags the price rise by 18–24 months.

Columbus Pro is an LGM and can get things wrong.

Columbus ProGIS made effortless

Try Demo

Enterprise-grade capabilities

Agent Research Report

Describe what you’re looking for and select the professional report you want. Columbus will investigate.

24/7 Human Support

Get personal support whenever you need it.

Light-speed Due Diligence

Input a land parcel, and choose the analysis you need. Columbus will complete due diligence in minutes.

High-fidelity and smart datasets

We vet our data with reputable partner organizations.

Use cases in your industry

Ask, Discover, Understand

With conversational map chat, ask your chat directly about anything and have a conversation like you’re talking to your best analyst — faster site-selection for Residential Real Estate customers, including Consultants, Residential Developers, and Wholesale brokers.
Columbusuntitled chat
Report ViewSave MapshotEdits not saved
Show me which neighborhoods in Amsterdam have seen the largest rent increases over the past 5 years
Columbus forecasted your question

Here are the Amsterdam neighborhoods with the steepest free-sector rent growth over the past five years

Top 4 Neighborhoods by Free-Sector Rent Growth
Last 5 Years
  1. 1De Pijp-Noord+28.4%
  2. 2Oud-West+24.1%
  3. 3Indische Buurt+21.6%
  4. 4Oostelijke Eilanden+19.3%
Key takeaway

Rent growth concentrates in tram-served neighborhoods with tight new-build pipelines; independent business turnover lags the price rise by 18–24 months.

Columbus Pro is an LGM and can get things wrong.

See what others cant

Sophisticated pattern detection. Ask chat to uncover hidden patterns across the map & data.

3 patterns detected

Across the Washington D.C metro area · Q3 2026

Rank the possibility of solar roof panel installation in this neighborhood

  • Unshaded South-Facing Roofs With Strong Daily Insolation
    312 homesSolar potential: High
  • Existing Rooftop Solar Arrays Already Installed
    47 homesStatus: Occupied
  • Workable Roofs Pending Minor Tree-Canopy Trimming
    186 homesSolar potential: Medium

Like weather forecasts for real estate

Like weather forecasts, but for residential real estate. Predict the future on Columbus.

Forecast residential prices, note future hot areas.

Powered by a deep-learning pattern recognition fed by the most up-to-date and high quality data.

Columbus forecasted your question

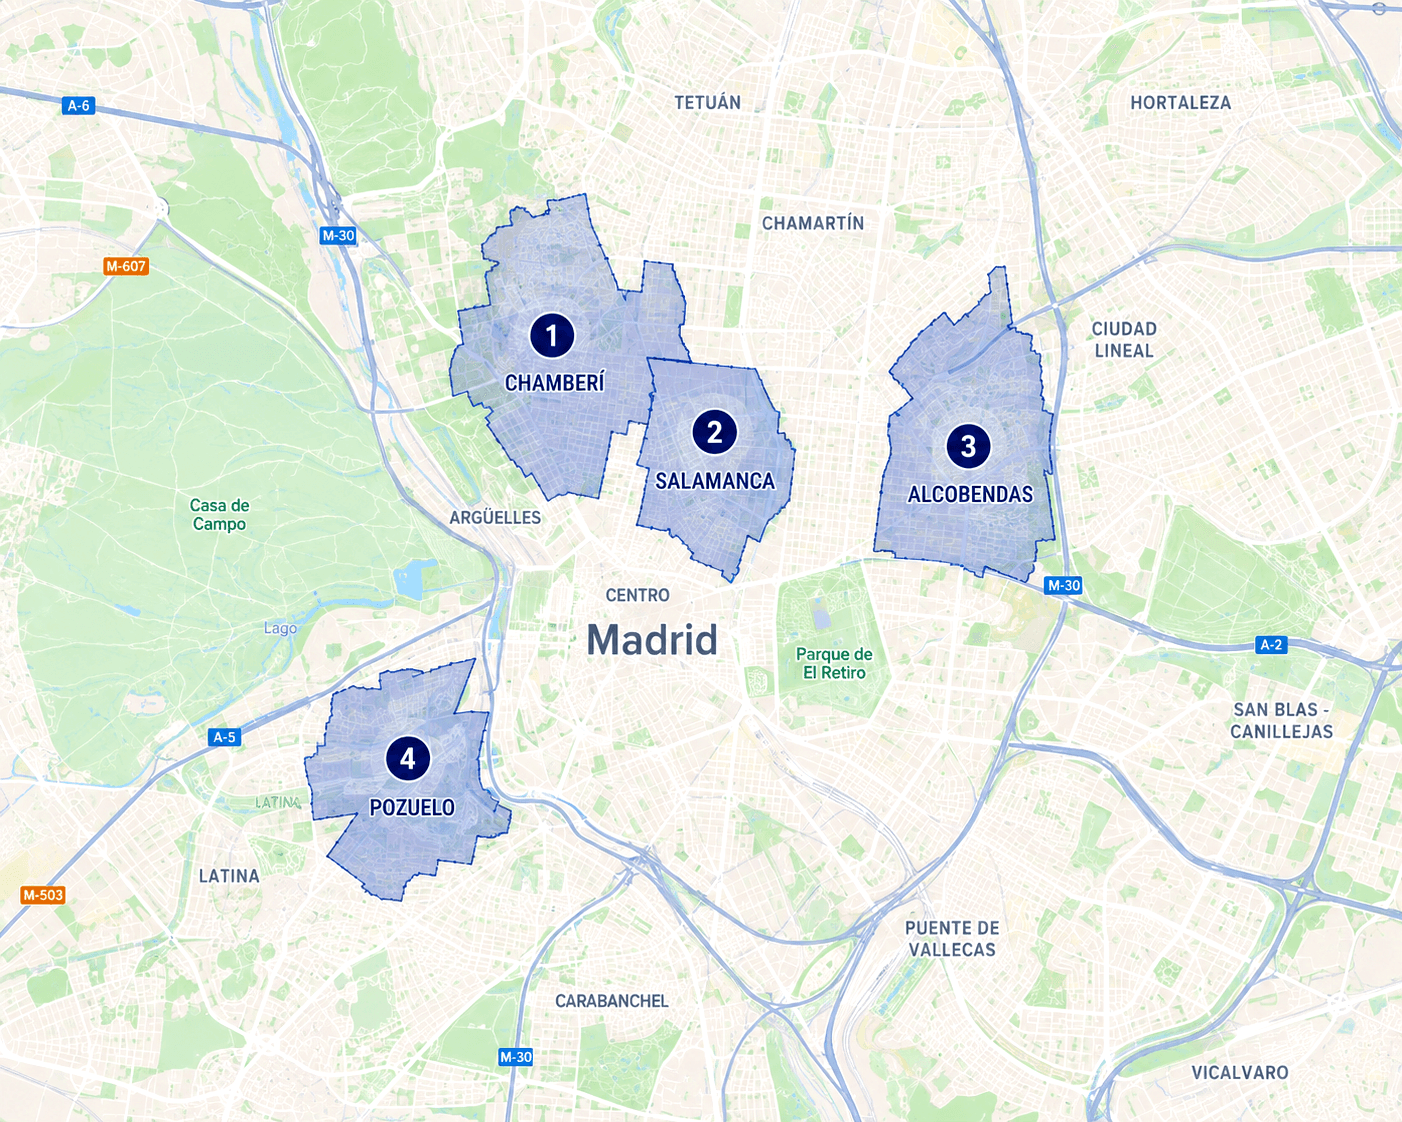
Here are the Madrid neighborhoods forecasted to see the highest selling prices for single-family homes in the next 1–2 years

Top 4 Neighborhoods by Forecasted Sale Price Growth
Next 24 Months
  • Chamberí
    +9.4%
  • Salamanca
    +8.1%
  • Alcobendas
    +7.2%
  • Pozuelo
    +6.5%
Key takeaway

Single-family demand in Madrid is concentrating in inner-ring neighborhoods with new transit, with Alcobendas leading the suburban set.

AI that critically thinks

Columbus AI considers a wide breadth of data everytime it critically thinks.

Transparent reasoning. You can tap to see all the investigation the AI does.

Should I acquire this 12,000 m² parcel in Alcobendas for a 60-unit residential project?
Columbus is reasoning

Columbus weighs:

  • Current zoning vs. likely upcoming municipal plan revisions
  • Absorption rate of comparable units in 5km radius
  • Demographic in-migration trends
  • Infrastructure load (school capacity, road throughput)
  • Competitor pipeline within the submarket
  • Mortgage rate sensitivity of the target buyer profile
  • Soil / flood / seismic risk layers
  • Historical permit approval timelines for this municipality

Drop Any File, Columbus does the rest

Drop in any file — Shapefile, KML, CSV, XLSX, PDF, CAD — Columbus harmonizes them and overlays them as a visualized map layer.

No schemas to define, no columns to map. Just upload and ask follow-up questions in plain English.

Columbus has harmonized your files

I’ve harmonized the files and displayed them on the map

  • ZoningMap_Municipal.pdfImported
  • shapefile_GIS_contractor.shpImported
  • parcel_addresses.xlsxImported
  • houseCAD_file.cadImported

now show me which of these parcels could legally hold a 60-unit project under current zoning

Trusted data, verified for confidence

Access proprietary data, and the highest quality data from our curated data catalogue. Data on Columbus is triple-checked.
ColumbusData Manager
Import dataData DigestionSmart Layers
My DataSuggestedAllBase MapsOverlaysPacksEnvironmentalInfrastructureSmart LayersDemographics
Future Hot Turnover Zones
55,010 rows

Predicts 2-5 year property value growth using migration, job forecasts, and permit trends.

Rental yield data by postal code (gross and net)
40,206 rows
Short-term rental saturation
33,520 rows

Airbnb density — relevant for assessing rental market dynamics.

Better Data, Better Prices

Purchase premium data at the most competitive prices.
Best Value

Columbus Data Layer

Market price

$2,600 / year

US Residential Market Intelligence — Enriched Parcel Layer
  • ~155M tax-assessor parcels
    Nationwide US parcel coverage enriched with transaction history, AVM estimates, demographic layers, and zoning — query-ready at county and ZIP granularity.
  • AVM + market comps included
    Estimated value, price per sqft, absorption rate, and rental yield resolved to the ZIP-code level.
  • Updated monthly
    Transaction and listing signals refreshed monthly; parcel geometry refreshed on the county assessor release cycle.

Best Competitor

Market price

From $54 / month · enterprise tiers quote-based

Per-asset valuation-platform subscription
  • Valuation-centric
    Optimized for individual asset appraisal; no parcel-level geospatial enrichment or zoning layer.
  • Per-asset billing
    Starts low for small portfolios; costs scale with monitored asset count rather than flat-rate access.
  • No bulk export
    Programmatic access for portfolio-scale queries requires a separate enterprise contract.

With smart layers, you become an artist

Columbus has brought accurate GenAI to GeoData.
Smart layers complete gaps in data when its unavailable or hard to survey. Columbus turns you into a Cartography artist
ColumbusSmart LayersFaçade Renovation Status
Columbus created a new smart layer

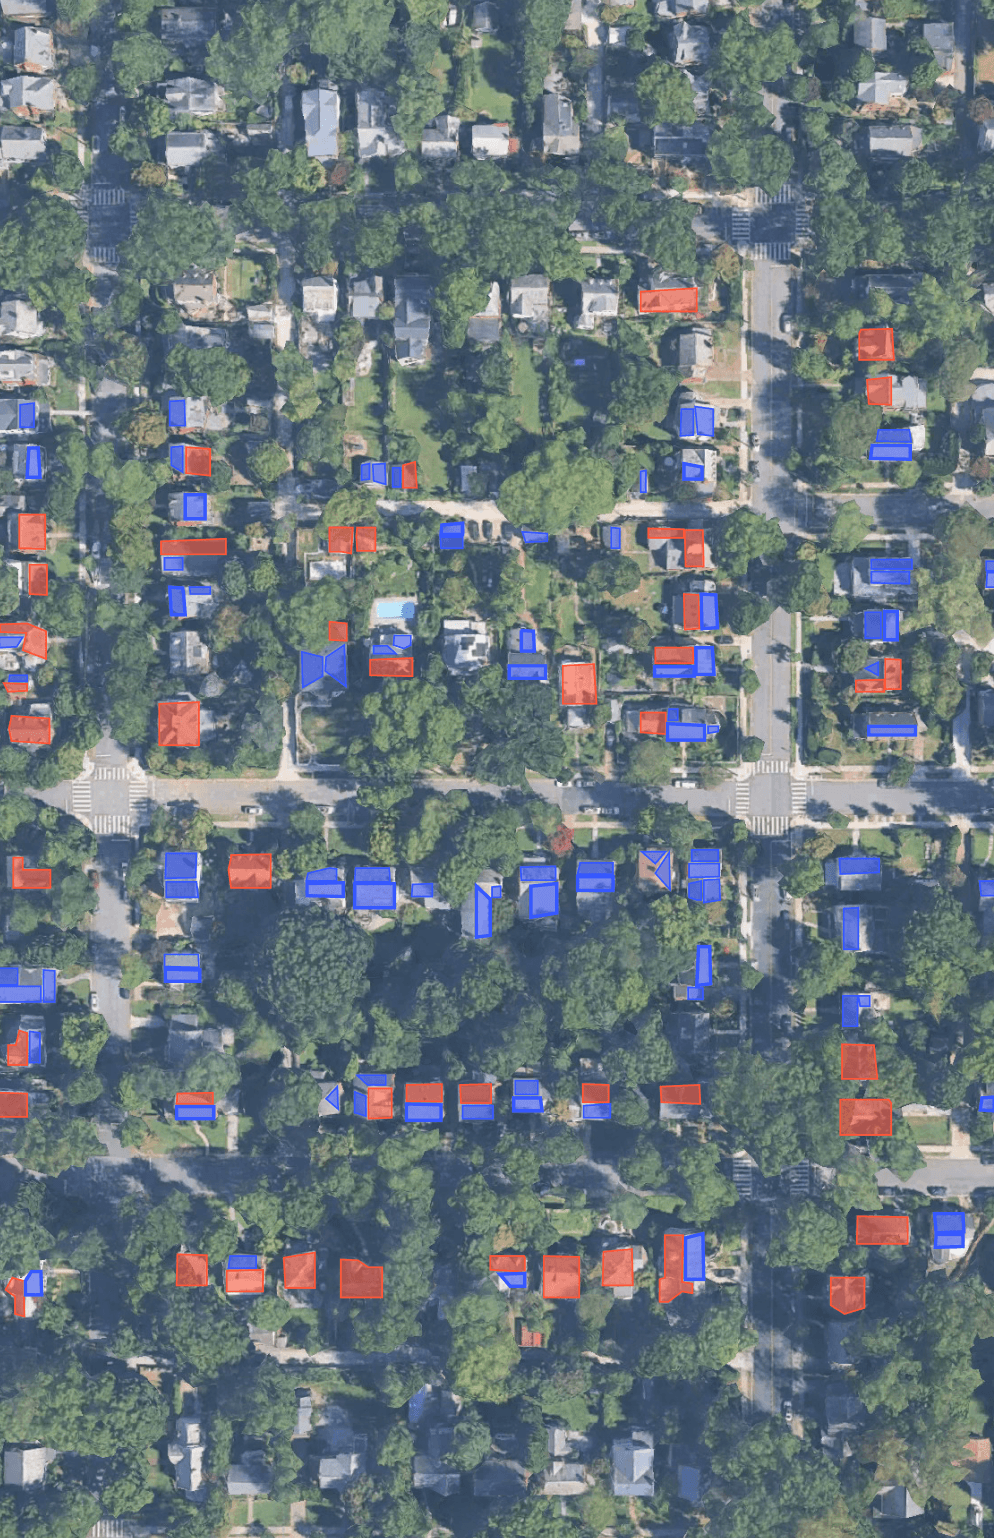
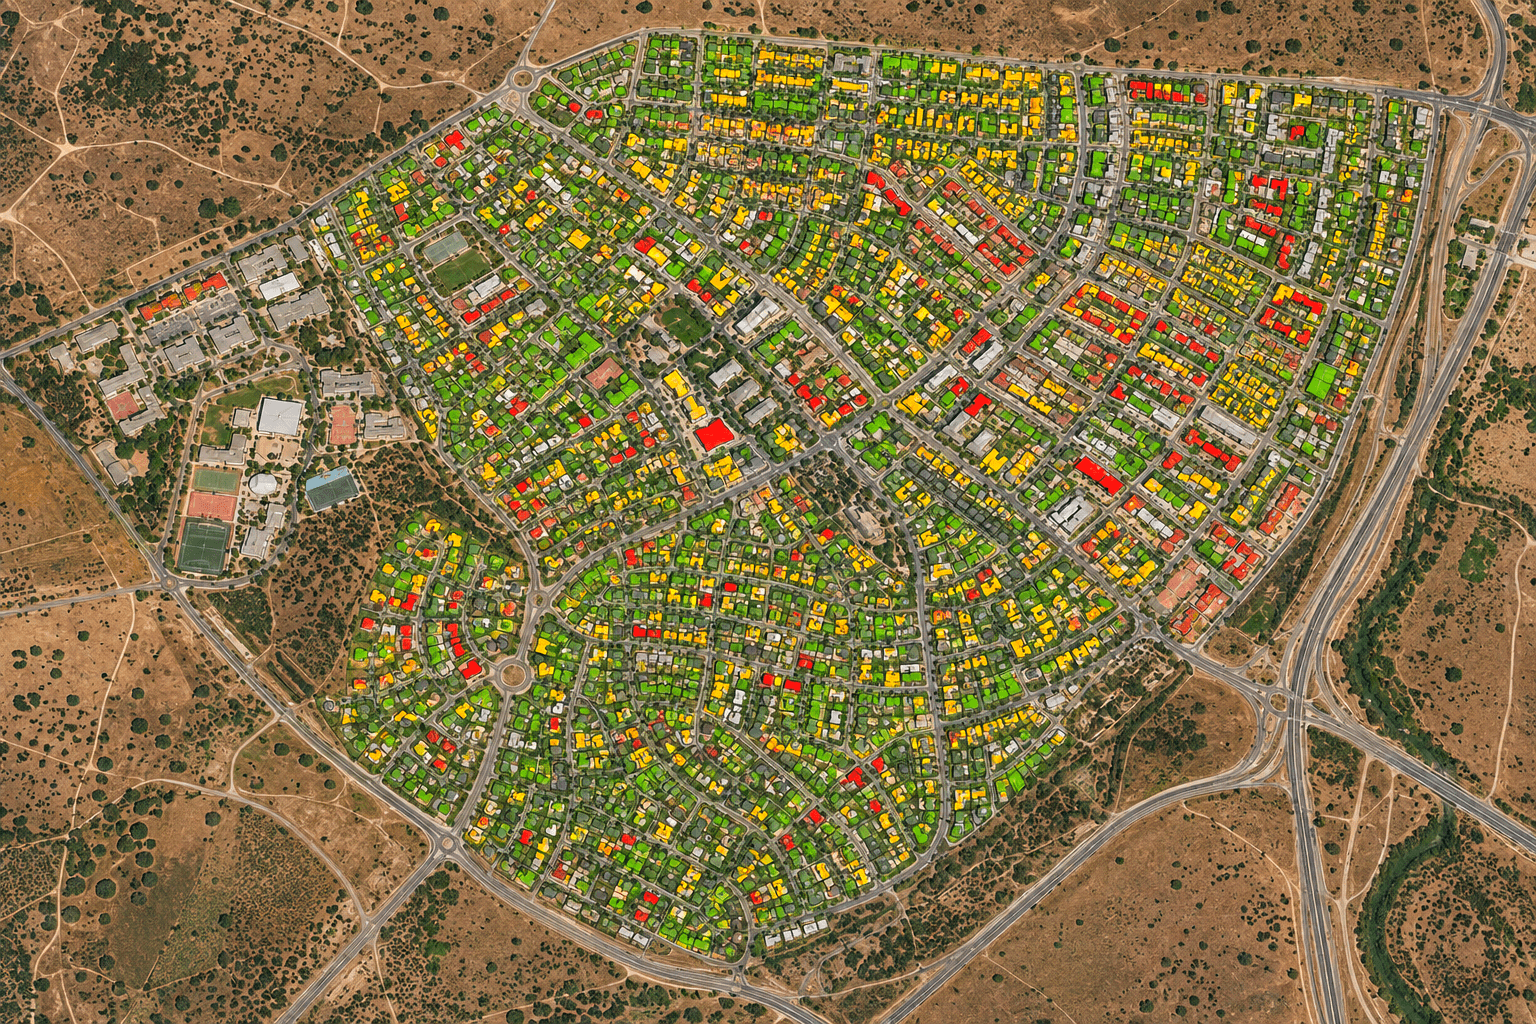
AI-generated layer classifying every residential building as Recently Renovated, Original Condition / Well-Maintained, or Deteriorated / Renovation Candidate.

Façade Renovation Status
Chevy Chase · every residential structure
Smart Layer
  • Inferred from satellite + street-level imagery
    Façade condition graded across the full municipality, even where survey data is missing.
  • Cross-checked against tax-assessor construction dates
    Triple-checked for completeness and consistency before every release.
  • Building-level scoring
    Fresh data, continuously monitored and maintained.

Generate a smart layer estimating building age, façade condition, and renovation status for every residential structure in Chevy Chase. Classify each building as: Recently Renovated (last 10 years), Original Condition / Well-Maintained, or Deteriorated / Renovation Candidate.

Smart Layers, allows you to come up with data layers that would’ve been too expensive or weird to survey. Taylor data layers to your exact needs, create maps about anything you can think of.

Survey the earth with a super model

Columbus is investigating
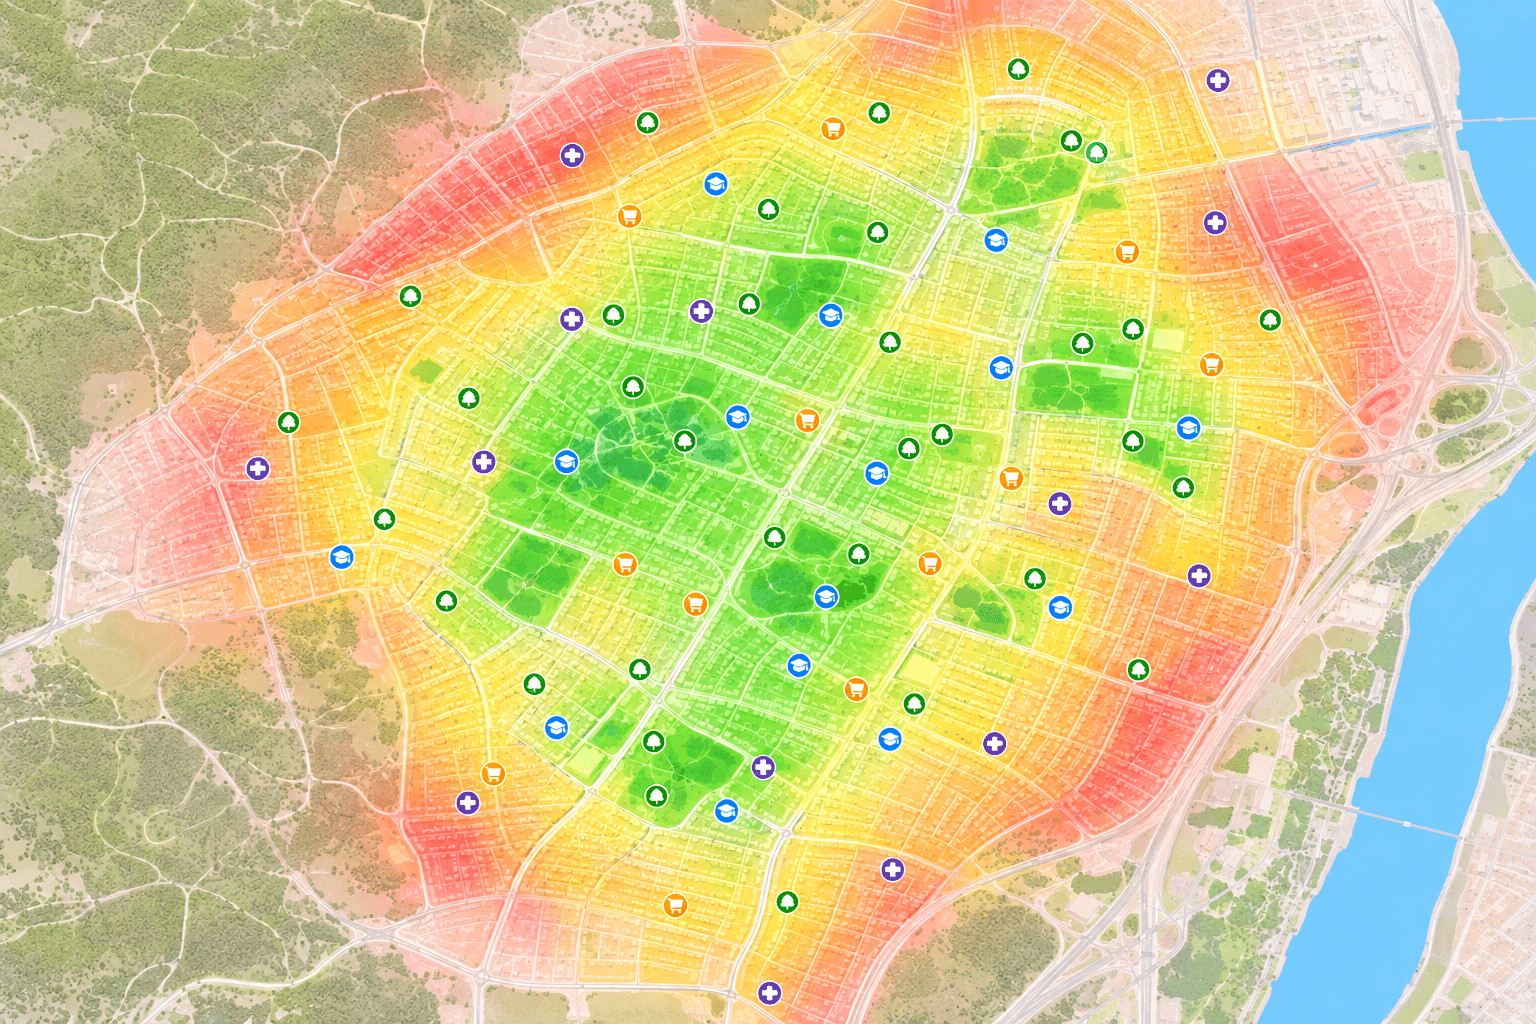
  • Considering proximity to public and private schools rated 7+/10
  • Filtering for density of parks over 0.5 acres within 500 ft walking distance
  • Filtering for presence of pediatric clinics and family healthcare within 1 mi
  • Filtering for traffic volume and street-safety scores on residential streets
  • Filtering density of grocery stores and pharmacies within walking distance

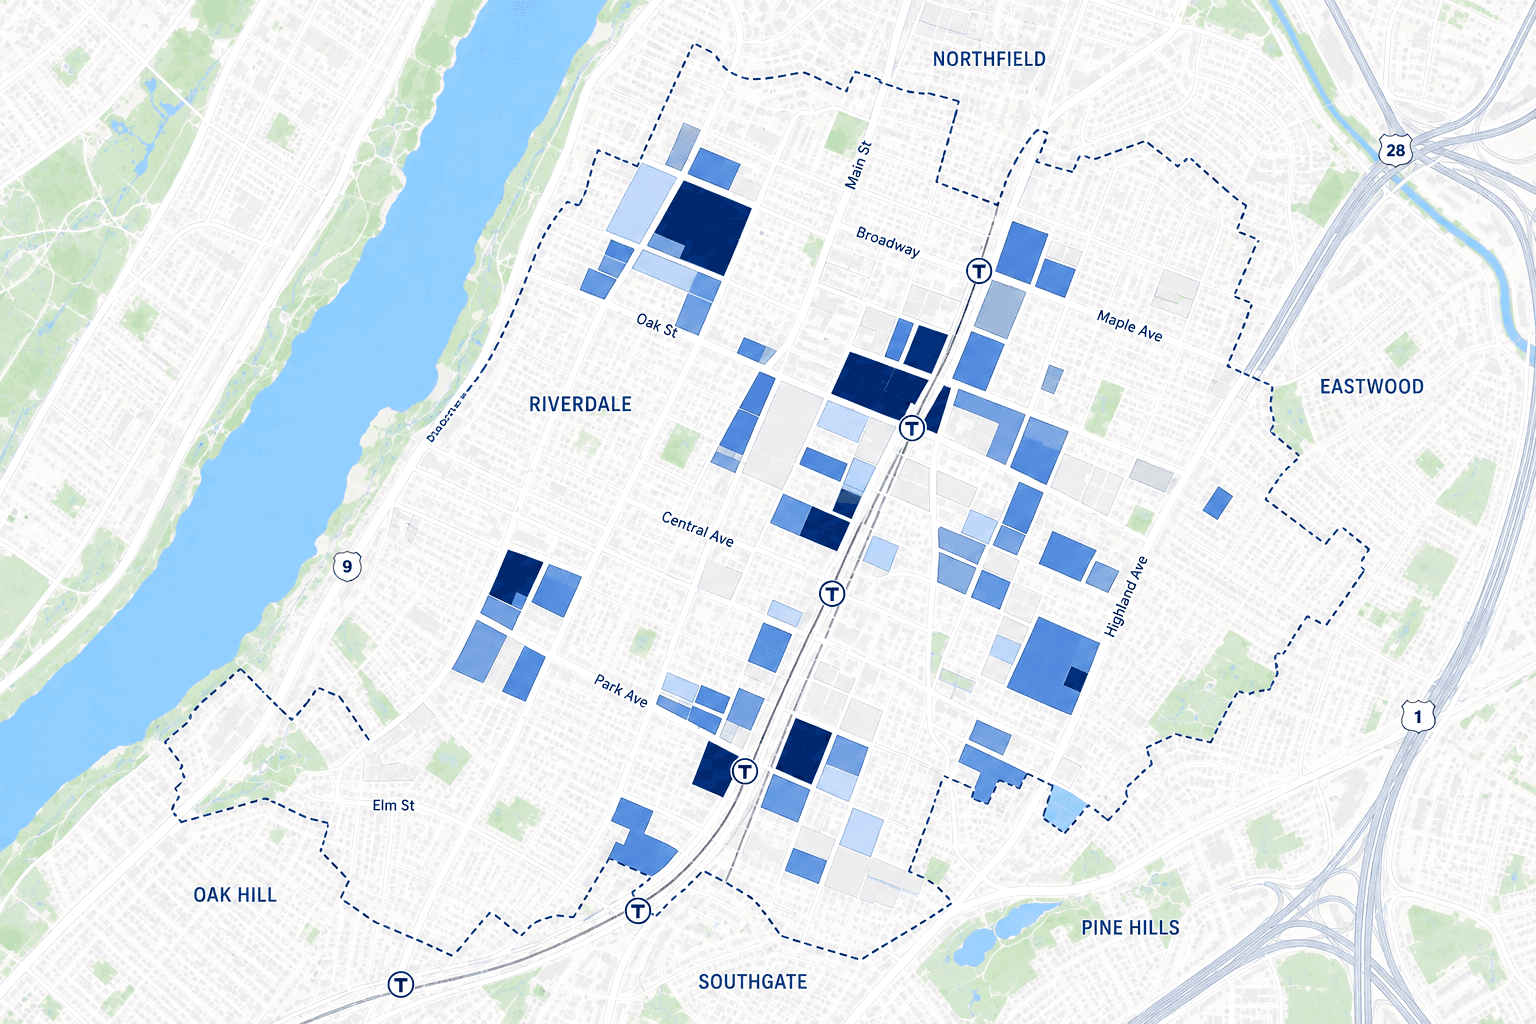
Create a smart layer showing 'family-friendliness density' — combining proximity to schools rated 7+/10, parks over 0.5 acres, pediatric clinics, low-traffic streets, and grocery stores within 500 ft walking distance.

Agentic Research

Hand Columbus your residential brief and grab a coffee — it’ll research new sites, run buyer-demand and absorption studies, and deliver professional, review-ready reports while you focus on other work.
ColumbusValencia Province SitesMid-Rise · 8,000–20,000 sqm
Shared withEdits saved
Find me the top 15 development sites for mid-rise residential in Valencia province, fitting our typical envelope: 8,000–20,000 m², residential or convertible zoning, within 30 minutes of city center, with positive demographic trajectory
Columbus forecasted your question

Here are the top 15 development sites for mid-rise residential across Valencia province that fit your envelope, zoning, and demographic criteria — the leading four shown

Top Sites by Development Suitability
Valencia Province · Mid-Rise · 8,000–20,000 m²
  • Quart de Poblet — Parc Central+95
  • Paterna — Lloma Llarga+91
  • Alboraya — Patacona+87
  • Mislata — Quart Sud+83
Key takeaway

The strongest sites cluster along the metro-served western corridor, where convertible zoning and net in-migration outpace the current mid-rise pipeline; PATRICOVA flood-zone exposure is the main constraint to screen next.

Columbus Pro is an LGM and can get things wrong.

Valencia Province Mid-Rise Sites: Western Metro-Corridor Convergence
Site Suitability Report · Residential · Jan 2026

Across Valencia province, the development sites best matching the 8,000–20,000 m² mid-rise envelope concentrate along the western metro corridor — Quart de Poblet, Paterna, Alboraya, and Mislata each clear the suitability threshold on zoning convertibility, sub-30-minute access to the city center, and positive demographic trajectory. These municipalities pair residential or readily convertible parcels with net in-migration running ahead of the current mid-rise pipeline.

Valencia Province · Site SuitabilityExpand
Columbus Agent

Consider layering the PATRICOVA flood-risk map to screen the western-corridor parcels before shortlisting.

Agentic Research Reports

Find the top development sites for mid-rise residential in your target region — review-ready shortlists with parcel-level comps and envelope criteria.

Agentic Audits and due diligence

Generative parcel due diligence: zoning, infrastructure, soil/flood/seismic risk, and competitor pipeline — with an on-the-ground surveying team available on request.

Audit Regulatory compliance

Audit candidate parcels for the legal maximum buildable residential square footage across all applicable zoning, overlays, and municipal regulations.

Dashboard

All your work organized and easy to access.
ColumbusDashboard
Tell Columbus Chatbot to search
AuditsSite SelectionsChatsMapshots
SelectSort by: Newest
Mechlen County 600k sqft Property Pipeline Analysis

Analyzed 3 candidate parcels in Mechlen County for a 600,000 sqft middle-income residential site; ranked Westfield Industrial Park at 94/100 against R-3 zoning, topography, flood risk, and utilities-infrastructure criteria.

May 21, 2026Public
Amsterdam Neighborhoods Rent Growth

Cross-referenced free-sector rent growth against tram-line corridor density across 24 Amsterdam neighborhoods; surfaced 4 high-growth pockets led by De Pijp-Noord at +28.4%, with takeaway on new-build pipeline tightness over a 5-year window.

May 18, 2026Private
Valencia Mid-Rise Shortlist

Investigated 4,200+ parcels across Valencia province for 8,000–20,000 m² mid-rise envelopes; prioritized 15 sites with positive demographic in-migration and competitor pipeline density inside a 30-minute drive-time radius.

May 12, 2026Private
Patraix flood-risk vs zoning overlay

Stacked the 2050 floodplain evolution model against R-3 zoning permissions and tram-line access in the Valencia Patraix district; flagged 3 parcels at acceptable risk and 2 with disqualifying drainage history for the rezoning panel.

May 6, 2026Public
Short-term rental saturation thresholds

Modeled Airbnb density against postal-code rental yields to identify where short-term rental saturation is depressing long-term residential pricing; produced a 7-tier saturation index with thresholds tuned to mid-tier metro residential portfolios.

Apr 28, 2026Private

Commonly asked questions

  • General chat models are built for text, so they summarize old articles about a place, guess at coordinates, and can't reach live data or hand you a map. Columbus Pro is built for the physical world. It reasons across fresh, coordinate-accurate data and gives you real maps, layers, forecasts, and review-ready reports, all powered by Magellan, our geospatial-reasoning engine.

  • We're the most versatile data collectors in the field. We run our own surveying and cartography, then pull from authoritative public, commercial, and partner datasets, fuse it all together, and validate every layer spatially. The result is current, coordinate-accurate, and ready to query. Columbus Pro's curated data catalogue is triple-checked and vetted with reputable partner organizations to deliver any dataset you may need.

  • Your data stays private and under your control. It's protected both while it's stored and while it travels between you and us, so it can't be read or intercepted by anyone else. Only the people you authorize can get in, your work is walled off from every other company, and you can always see exactly who did what. Most important for an AI company: we never use your private data to train shared models, so anything you upload or create stays yours. Under the hood, that's AES-256 encryption at rest, TLS 1.2 and 1.3 in transit, SSO through SAML and OIDC, role-based access, MFA, and full audit logging.

  • No. We specifically designed Columbus Pro to be simple and intuitive to use by anyone without prior experience. Everyone on your team can ask the map a question in plain English and get an easy-to-read answer back. And it stays easy without giving up depth: GIS professionals get the full control and transparent reasoning to take any project as far as it needs to go.


Chat with us now about Columbus Pro

Talk to Founders
Columbusuntitled chat
Report ViewSave MapshotEdits not saved
Forecast the districts in greater Munich most at risk of traffic-congestion growth over the next 2–3 years
Columbus forecasted your question

Here are the districts in greater Munich forecasted to experience the worst traffic-congestion growth over the next 2–3 years

Top 4 Districts by Forecasted Congestion Growth
Next 24–36 Months
  1. 1Schwabing-West+14.2%
  2. 2Bogenhausen+12.8%
  3. 3Sendling-Westpark+11.1%
  4. 4Riem+9.7%
Key takeaway

Congestion growth concentrates on residential pipelines feeding the BMW / Siemens employment ring, with S-Bahn capacity ceilings amplifying spill-over.

Columbus Pro is an LGM and can get things wrong.